Transforming RMM Signals into Operations: SLA-Driven Monitoring for Multi-Site Infrastructure
Collecting telemetry is trivial; transforming raw server and network events into decisive operational outcomes is where most IT organizations fail. Remote Monitoring and Management (RMM) platforms and network management systems generate thousands of signals every hour. However, when every ping failure, transient CPU spike, or disk threshold warning triggers a high-priority ticket, team members quickly develop alert fatigue. Critical outages get buried under hundreds of false positives, mean time to resolution (MTTR) inflates, and client communications become reactive and fragmented.
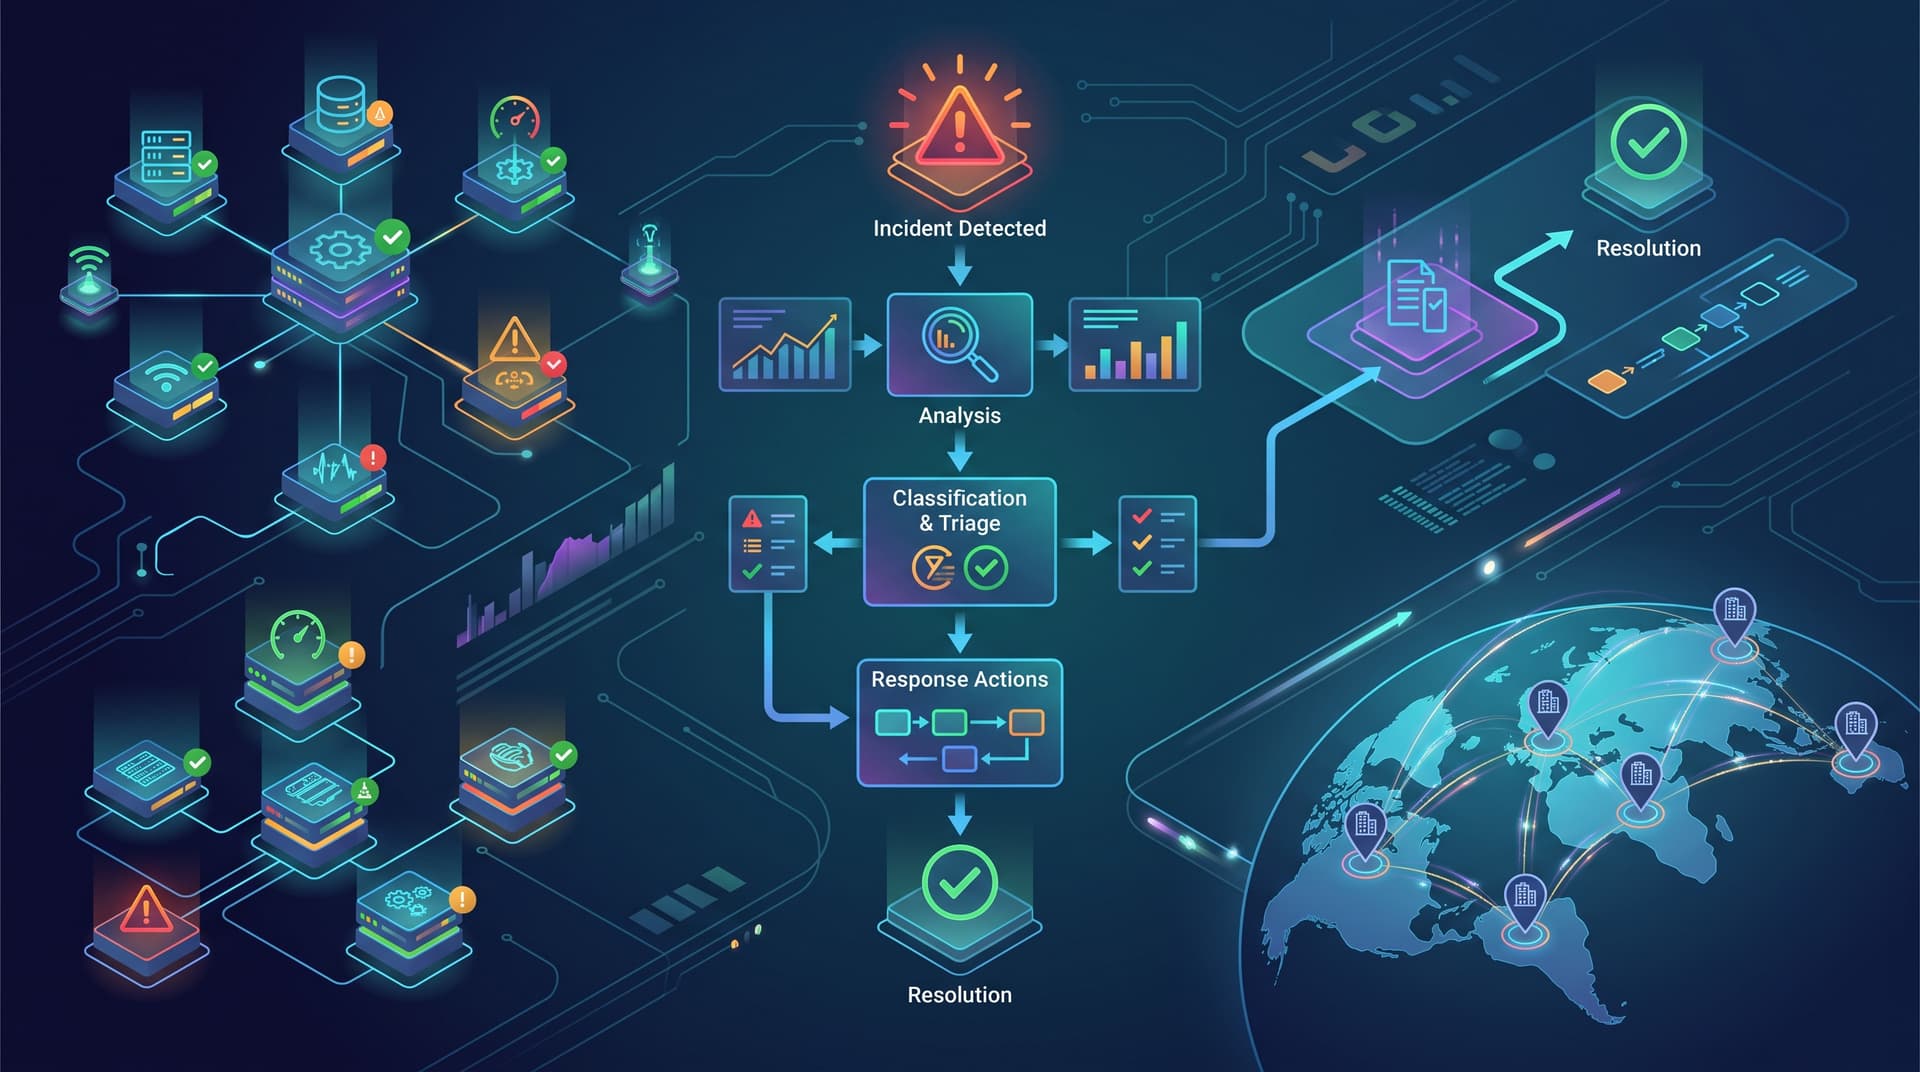
To build a resilient IT environment, operations leaders must establish a clear boundary between monitoring (data gathering) and response (governed execution). This guide details how to structure alert ownership, tune signal thresholds, build resilient workflows for multi-site SMBs with variable network stability, and systematically lower MTTR.
1. Monitoring vs. Meaningful Response: Ownership, Runbooks, and Communication
Monitoring is passive observation. It measures metrics such as interface throughput, CPU usage, ping response, and service states. Response, by contrast, is an operational commitment governed by ownership, execution standards, and clear stakeholder communications.
Defining Unambiguous Alert Ownership
An alert generated without a designated owner is merely background noise. Every actionable alert category must map directly to a role, team, or automated remediation workflow:
- Primary Responder: The operational role responsible for initial triage within a defined service level agreement (SLA).
- Escalation Path: Designated secondary and tertiary engineers who assume command if the primary responder does not acknowledge or resolve the event within specified timeframes.
- Service Owner: The engineering manager or team lead accountable for threshold accuracy and runbook maintenance for that specific service asset.
When ownership is ambiguous, technicians assume someone else is addressing the issue. Establishing strict primary ownership ensures every critical alert triggers an immediate, accountable response.
Codifying Triage through Standardized Runbooks
A runbook transforms raw alerts into predictable step-by-step resolution actions. Effective runbooks remove guesswork during high-pressure outages by defining:
- Validation Steps: How to confirm whether the alert represents a real impact or a false positive (e.g., cross-checking host ping with application-layer HTTP health endpoints).
- Immediate Remediation Actions: Permitted safe actions, such as restarting specific services, clearing temporary cache partitions, or failing over redundant gateway links.
- Escalation Triggers: Exact operational conditions under which the incident must be escalated to Tier 2/3 engineering or vendor support.
- Impact Assessment: Criteria for determining affected users, departments, or business processes.
Transparent Client and Stakeholder Communication
Alert response extends beyond technical remediation. Ops teams must manage client expectations through structured communication protocols:
- Automated Incident Notifications: Restrict notifications to verified service-impacting events rather than raw infrastructure alerts.
- Status Updates: Provide standard status cadence (e.g., every 30 minutes for Critical P1 events) containing current findings, active mitigation steps, and estimated time to restoration.
- Post-Incident Reviews: Document root causes, remediation timelines, and preventive actions to build long-term operational transparency.
2. Alert Tuning, Escalation Tiers, and After-Hours Handling
Without rigorous threshold tuning, engineering teams inevitably drown in non-actionable notifications. Reducing noise requires systematically categorizing telemetry into distinct priority tiers.
| Severity Level | Trigger Condition | Notification Channel | Target Ack Time | Resolution Owner |
|---|---|---|---|---|
| P1 - Critical | Total service outage, primary firewall down, database cluster fail | Voice dispatch, SMS, High-priority push | < 15 Minutes | On-Call Lead / Tier 3 |
| P2 - High | Redundant hardware failure, localized site drop, high memory pressure | Direct Slack/Teams Pager, Queue Assignment | < 30 Minutes | Tier 2 Operations |
| P3 - Moderate | Non-critical service degradation, backup job warning | Standard Helpdesk Queue | < 4 Hours | Tier 1 Service Desk |
| P4 - Low | Routine maintenance, disk space threshold (>80%) | Digest Report / Quiet Log | < 24 Hours | Automation / Admin |
Threshold Tuning Practices
To eliminate non-actionable alerts, operational teams should implement:
- Consecutive Sample Rules: Require 3 to 5 consecutive failed polling cycles (e.g., 5 minutes of ping loss) before generating an incident ticket.
- Dynamic Thresholds: Adjust thresholds based on operational schedules. A server running scheduled nightly backups shouldn't trigger high CPU alerts at 2:00 AM.
- Hysteresis Windows: Prevent alert flapping by requiring metrics to drop significantly below the warning threshold before clearing or re-triggering.
After-Hours On-Call Protocols
Unrestricted after-hours alerting leads to technician burnout and high turnover. After-hours paging must be limited exclusively to P1 events that directly impact core business operations. Non-urgent issues (such as low disk space or single-disk RAID degradation on redundant arrays) must be deferred to the next business day's queue.
3. Managing Multi-Site SMBs with Uneven Network Quality
Small and mid-sized businesses (SMBs) with distributed locations—such as retail branches, logistics warehouses, or regional medical clinics—frequently contend with consumer-grade or variable-quality broadband connections. In these environments, naive ping monitoring creates constant alert storms as micro-outages, packet jitter, and transient ISP routing flaps fire false alarms.
Architectural Strategies for Variable Network Quality
To maintain reliable visibility across multi-site environments without triggering alert fatigue:
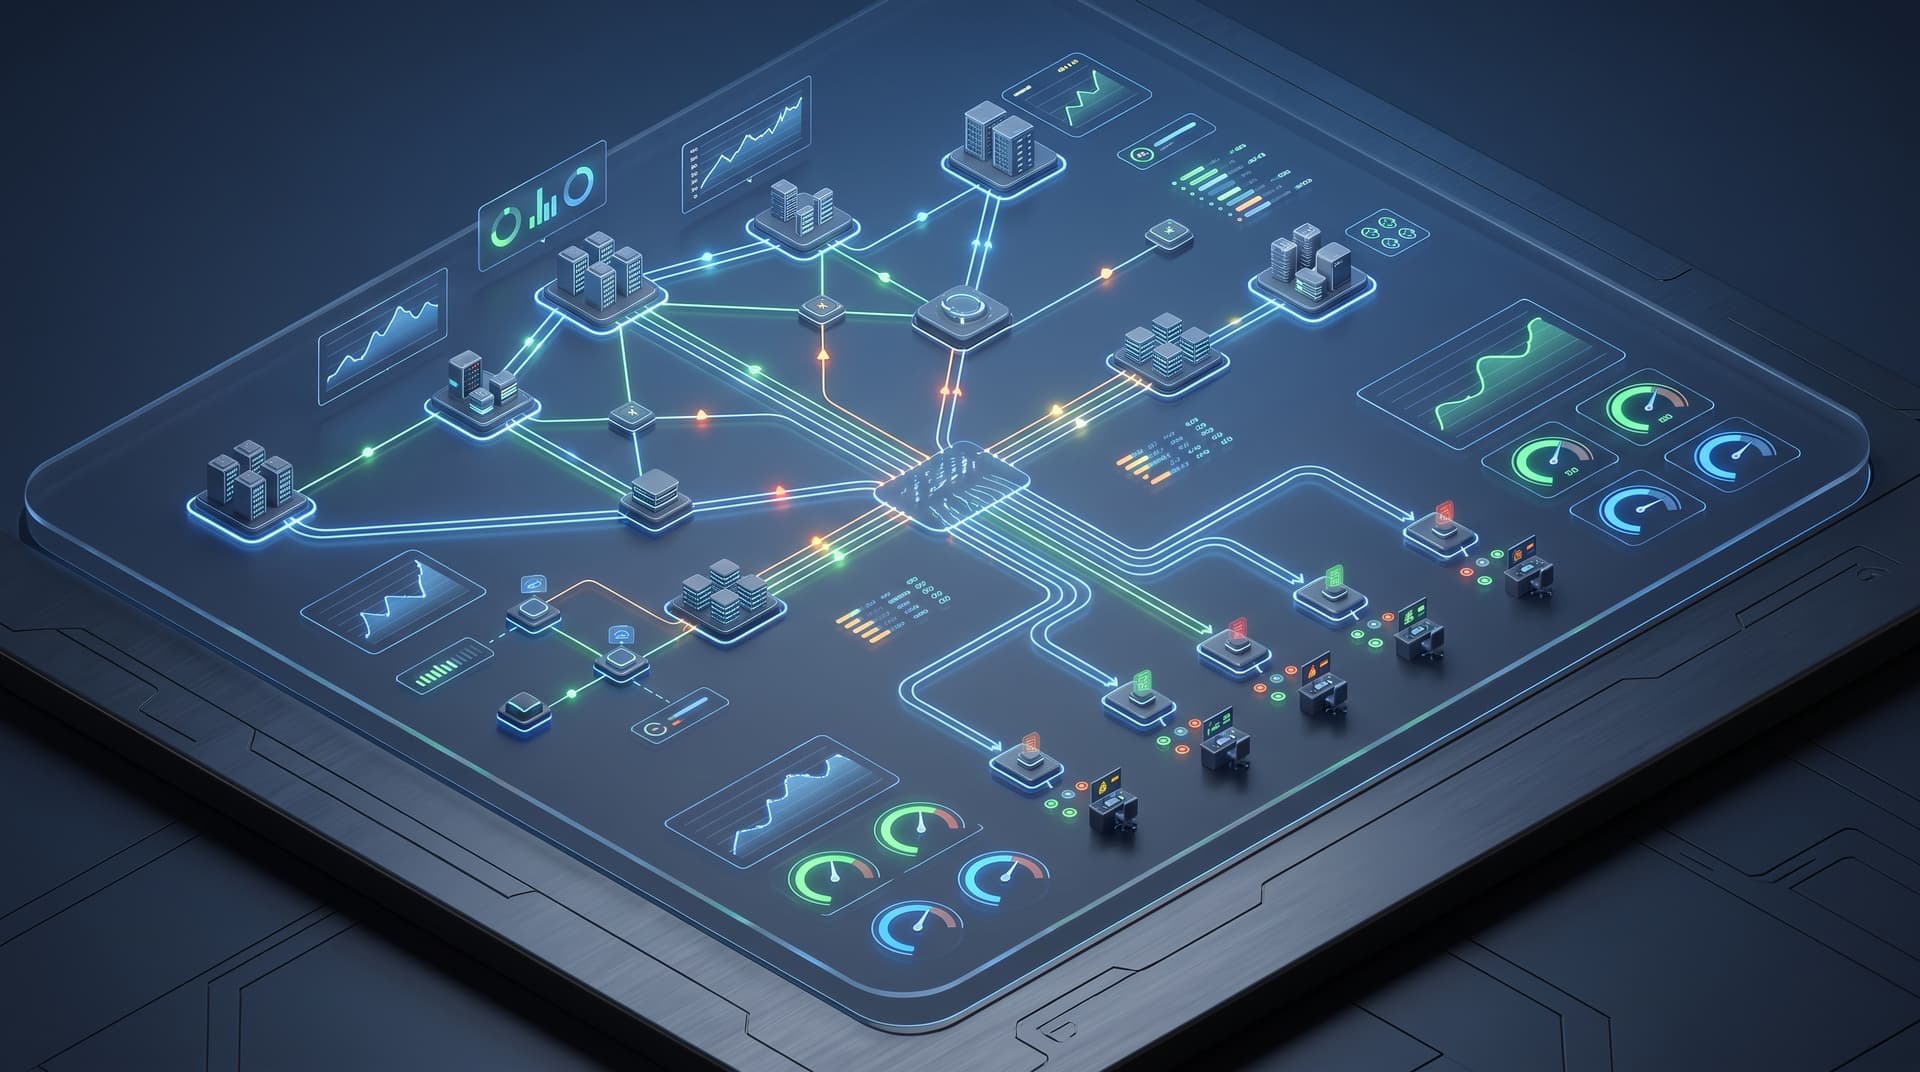
- Parent-Child Telemetry Dependency: Map network topology in your monitoring solution. If a primary edge router fails, the system must suppress alerts for all downstream switches, access points, and IP phones, generating a single root-cause router incident.
- Edge Proxy Polling: Place an onsite probe or edge proxy within each branch facility. The central monitoring controller checks health against the edge proxy. Internal branch communications are monitored locally, preventing external WAN latency from triggering false internal device failure alerts.
- Adaptive Latency and Jitter Buffers: Standardize ping testing across multi-site WAN links using longer time-to-live (TTL) settings and continuous packet loss averaging rather than instant drop thresholds.
- Dual-WAN Path Health Checks: For locations with primary and cellular backup WAN connections, isolate link status alerts from system availability alerts. A failover to cellular should register as a P3 network status event, not a P1 site-offline catastrophe.
4. Measuring MTTR and Continuous Threshold Optimization
Improving incident response requires tracking precise metrics across the operational lifecycle:
Takeaway: True operational efficiency is achieved when Mean Time to Detect (MTTD), Mean Time to Acknowledge (MTTA), and Mean Time to Resolve (MTTR) are tracked as interconnected operational benchmarks.
Key Performance Metrics
- Mean Time to Detect (MTTD): Time elapsed between asset failure and system alert generation. Optimized through precise polling rates and proactive synthetic checks.
- Mean Time to Acknowledge (MTTA): Time from alert creation to owner assignment. Reduced by effective escalation tiers and automated dispatch routing.
- Mean Time to Resolve (MTTR): Total duration from incident inception to full service restoration. Improved through actionable runbooks, self-healing automation scripts, and streamlined escalation protocols.
Weekly Signal Audits and Continuous Refinement
Operations leaders should conduct weekly alert hygiene reviews:
- Identify the top 10 most frequent alert generators across all monitored assets.
- Adjust thresholds or rewrite runbooks for recurring alerts that resulted in no manual intervention.
- Convert repetitive Tier 1 manual steps into automated remediation workflows using platform mechanisms.
Conclusion: Transform Monitoring into Proactive Resilience
Raw monitoring data is only as valuable as the response process built around it. By defining explicit alert ownership, establishing tiered escalation pathways, tuning thresholds for uneven multi-site environments, and enforcing runbook execution, operations leaders can permanently eliminate alert fatigue and dramatically reduce MTTR.
Ready to convert noisy infrastructure logs into streamlined operational response? Ask Bitscaled to tune monitoring thresholds and define alert ownership for your environment. Discover how our Managed Infrastructure Services and Platform Telemetry Tools bring clarity and speed to your IT operations.